Categories
Epanet IBM R

Milestones for epanetReader

Nearly two years ago, I released a package for reading water network data into R. The package, called epanetReader has had a few milestones recently so I thought it would be good to celebrate with a blog post.

Featured in IBM’s Environment Report

The epanetReader package makes IBM’s corporate environmental report for 2016. You can read all about it on page 43.

Now in 100 Countries

In June 2017, Uruguay became the 100th country where epanetReader was downloaded from RStudio’s CRAN server.  Welcome to the colleagues in Uruguay! The total number of downloads from this server is now over 6000.  There are about 120 other CRAN servers that do not provide logs so the total number of downloads is anyone’s guess.

New Release

Version 0.5.1 was released to CRAN on 26 May 2017.  This version adds a new plotting option to include labels of elements in the network, similar to the windows graphical interface.  Labels are enabled like this:

plot(Net1, plot.labels = TRUE)
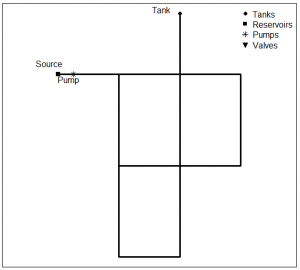
The new release also includes the test suite as part of the CRAN package. Previously, the test suite was only available on github. Now the tests are fully part of the package and run as part of the package checking process. Code coverage is currently at 94%.  Contributions of new tests to improve the  coverage are very welcome.

Categories
Epanet R

epanetReader now supports EPANET-MSX and Sparklines

epanetReader v0.3.1 is now available on CRAN.  This new version has several updates and enhancements:

  • Added read.msxrpt() function to read results of multi-species water quality simulations made with EPANET-MSX
  • Added plotSparklineTable() function to generate tables of sparklines for exploratory analysis
  • Added data objects Net1 and Net1rpt in rdata format so some examples run without having to parse the text files.
  • Changed treatment of some columns of sections of .inp files from character to factor to improve summaries (e.g. Pipe Status, Valve Type)
  • Added support to read Status and Demands sections of .inp files
  • Plotting changes for simulation results: fixed bug for plotting with valves, changed aspect ratio to 1 for maps

Update to the version or install for the first time by running the following command in an R session.
> install.packages("epanetReader")

Categories
Epanet R

Analyze Water Networks using Epanet and R with epanetReader

Epanet is a popular software for water network simulation freely available from the US Environmental Protection Agency.  R is a popular and freely available environment for computing and graphics.

epanetReader is a new add-on package for R that reads Epanet files for further analysis and visualization.  As of today, epanetReader is now available through the R archive (CRAN) in addition to GitHub. For those already familiar with Epanet and R, get started by installing the package.

> install.packages("epanetReader")  
> library(epanetReader) 

Read in your favorite network file this way

 > n1 <- read.inp("Net1.inp") 

Get a quick summary of the network using the summary() function
> summary(n1)

Look at the package page on GitHub github.com/bradleyjeck/epanetReader or the following help functions for further examples of package usage.
> help(read.inp)
> help(read.rpt)

If you are interested in water networks, but new to R or Epanet here are a few
resources to get started.

Feedback on the package is most welcome! Details are on the Contact page.